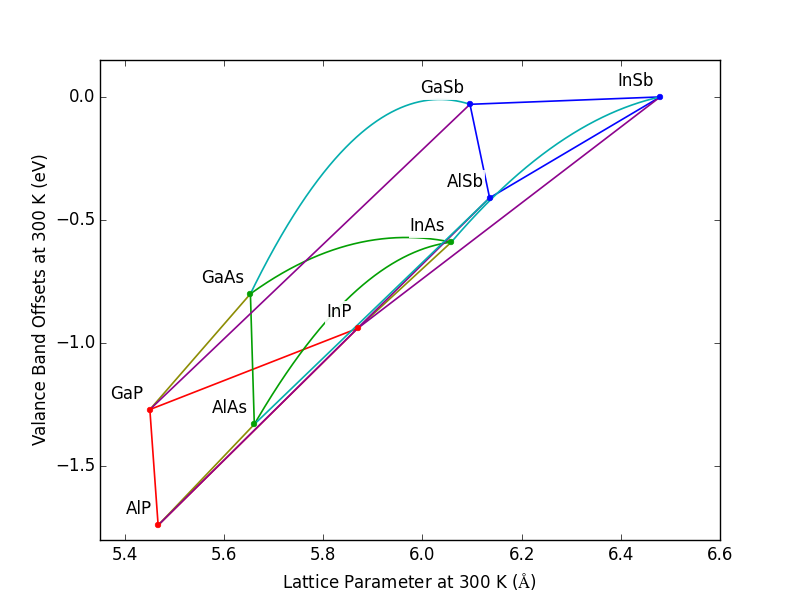
Plot Valance Band Offset vs Lattice Constant
Source:
#
#   Copyright (c) 2013-2014, Scott J Maddox
#
#   This file is part of openbandparams.
#
#   openbandparams is free software: you can redistribute it and/or modify
#   it under the terms of the GNU Affero General Public License as published
#   by the Free Software Foundation, either version 3 of the License, or
#   (at your option) any later version.
#
#   openbandparams is distributed in the hope that it will be useful,
#   but WITHOUT ANY WARRANTY; without even the implied warranty of
#   MERCHANTABILITY or FITNESS FOR A PARTICULAR PURPOSE.  See the
#   GNU Affero General Public License for more details.
#
#   You should have received a copy of the GNU Affero General Public License
#   along with openbandparams.  If not, see <http://www.gnu.org/licenses/>.
#
#############################################################################
# Make sure we import the local openbandparams version
import os
import sys
sys.path.insert(0,
    os.path.abspath(os.path.join(os.path.dirname(__file__), '../..')))
from openbandparams import *

import matplotlib.pyplot as plt
import numpy


T = 300
T_lattice = 300

# initialize the plot
fig = plt.figure()
ax = fig.add_subplot(111)
plt.xlabel('Lattice Parameter at %g K ($\AA$)' % T_lattice)
plt.ylabel('Valance Band Offsets at %g K (eV)' % T)

# Define colors
red = '#FE0303'
green = '#04A004'
blue = '#0404FF'
red_green = '#8D8D04'
red_blue = '#8D048D'
green_blue = '#04AEAE'

# list the binaries
phosphide_binaries = [AlP, GaP, InP]  # red
arsenide_binaries = [AlAs, GaAs, InAs]  # green
antimonide_binaries = [AlSb, GaSb, InSb]  # blue

# list the ternaries
phosphide_ternaries = [AlGaP, AlInP, GaInP]  # red
arsenide_ternaries = [AlGaAs, AlInAs, GaInAs]  # green
antimonide_ternaries = [AlGaSb, AlInSb, GaInSb]  # blue
phosphide_arsenide_ternaries = [AlPAs, GaPAs, InPAs]  # red + green
phosphide_antimonide_ternaries = [AlPSb, GaPSb, InPSb]  # red + blue
arsenide_antimonide_ternaries = [AlAsSb, GaAsSb, InAsSb]  # green + blue

# plot the ternaries
fractions = numpy.linspace(0, 1, 1000)
for ternaries, color in [(phosphide_ternaries, red),
                         (arsenide_ternaries, green),
                         (antimonide_ternaries, blue),
                         (phosphide_arsenide_ternaries, red_green),
                         (phosphide_antimonide_ternaries, red_blue),
                         (arsenide_antimonide_ternaries, green_blue)]:
    for ternary in ternaries:
        ax.plot([ternary.a(x=f, T=T_lattice) for f in fractions],
                [ternary.VBO(x=f, T=T) for f in fractions],
                color=color,
                linewidth=1.2)

# plot and label the binaries
x = []
y = []
label = []
for binaries, color in [(phosphide_binaries, red),
                         (arsenide_binaries, green),
                         (antimonide_binaries, blue)]:
    ax.plot([b.a(T=T_lattice) for b in binaries],
            [b.VBO(T=T) for b in binaries],
            color=color,
            linestyle=' ',
            marker='o',
            markersize=4,
            markeredgecolor=color)
    x.extend([b.a(T=T_lattice) for b in binaries])
    y.extend([b.VBO(T=T) for b in binaries])
    label.extend([b.name for b in binaries])

for x, y, label in zip(x, y, label):
    ax.annotate(label, xy=(x, y), xytext=(-5, 5), ha='right', va='bottom',
                bbox=dict(linewidth=0, fc='white', alpha=0.9),
                textcoords='offset points')

plt.xlim(5.35, 6.6)
plt.ylim(-1.8, 0.15)

if __name__ == '__main__':
    import sys
    if len(sys.argv) > 1:
        output_filename = sys.argv[1]
        plt.savefig(output_filename)
    else:
        plt.show()
Result: