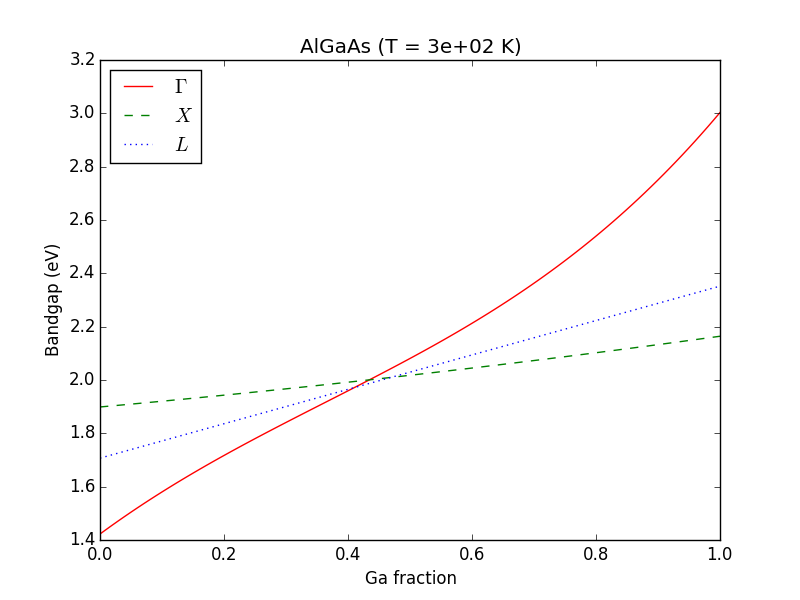
Plot Bandgap vs Composition of Ternary
Source:
#
#   Copyright (c) 2013-2014, Scott J Maddox
#
#   This file is part of openbandparams.
#
#   openbandparams is free software: you can redistribute it and/or modify
#   it under the terms of the GNU Affero General Public License as published
#   by the Free Software Foundation, either version 3 of the License, or
#   (at your option) any later version.
#
#   openbandparams is distributed in the hope that it will be useful,
#   but WITHOUT ANY WARRANTY; without even the implied warranty of
#   MERCHANTABILITY or FITNESS FOR A PARTICULAR PURPOSE.  See the
#   GNU Affero General Public License for more details.
#
#   You should have received a copy of the GNU Affero General Public License
#   along with openbandparams.  If not, see <http://www.gnu.org/licenses/>.
#
#############################################################################
# Make sure we import the local openbandparams version
import os
import sys
sys.path.insert(0,
    os.path.abspath(os.path.join(os.path.dirname(__file__), '../..')))
from openbandparams import *

import matplotlib.pyplot as plt
import numpy

alloy = AlGaAs

# calculate the data
xs = numpy.linspace(0, 1, 100)
T = 300  # K
gamma = [alloy.Eg_Gamma(x=x, T=T) for x in xs]
X = [alloy.Eg_X(x=x, T=T) for x in xs]
L = [alloy.Eg_L(x=x, T=T) for x in xs]

# plot it
fig = plt.figure()
ax = fig.add_subplot(111)
plt.title('%s (T = %.2g K)' % (alloy.name, T))
plt.xlabel('%s fraction' % alloy.elements[1])
plt.ylabel('Bandgap (eV)')
ax.plot(xs, gamma, 'r-', label='$\Gamma$')
ax.plot(xs, X, 'g--', label='$X$')
ax.plot(xs, L, 'b:', label='$L$')
plt.legend(loc='best')

if __name__ == '__main__':
    import sys
    if len(sys.argv) > 1:
        output_filename = sys.argv[1]
        plt.savefig(output_filename)
    else:
        plt.show()
Result: