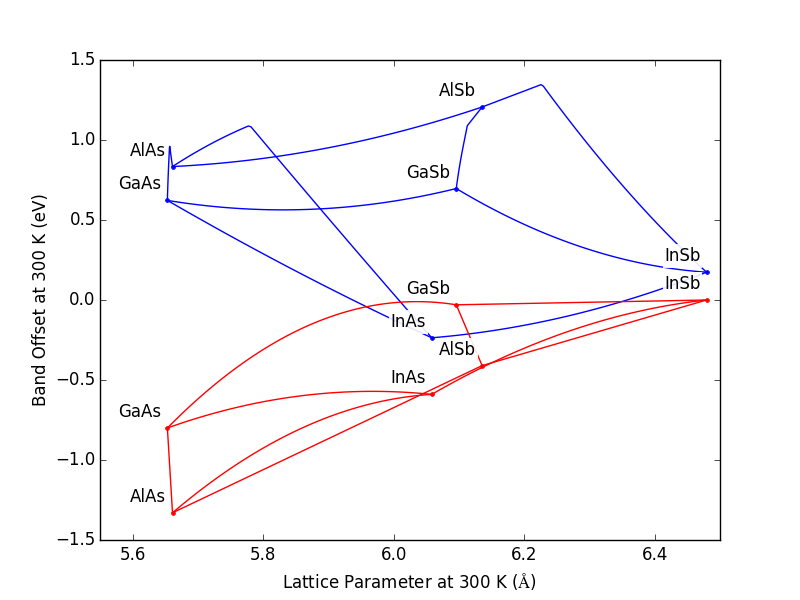
Plot Band Offset vs Lattice Constant No Phosphides
Source:
#
#   Copyright (c) 2013-2014, Scott J Maddox
#
#   This file is part of openbandparams.
#
#   openbandparams is free software: you can redistribute it and/or modify
#   it under the terms of the GNU Affero General Public License as published
#   by the Free Software Foundation, either version 3 of the License, or
#   (at your option) any later version.
#
#   openbandparams is distributed in the hope that it will be useful,
#   but WITHOUT ANY WARRANTY; without even the implied warranty of
#   MERCHANTABILITY or FITNESS FOR A PARTICULAR PURPOSE.  See the
#   GNU Affero General Public License for more details.
#
#   You should have received a copy of the GNU Affero General Public License
#   along with openbandparams.  If not, see <http://www.gnu.org/licenses/>.
#
#############################################################################
# Make sure we import the local openbandparams version
import os
import sys
sys.path.insert(0,
    os.path.abspath(os.path.join(os.path.dirname(__file__), '../..')))
from openbandparams import *


import matplotlib.pyplot as plt
import numpy

T = 300

# initialize the plot
fig = plt.figure()
ax = fig.add_subplot(111)
plt.xlabel('Lattice Parameter at %g K ($\AA$)' % T)
plt.ylabel('Band Offset at %g K (eV)' % T)

# plot the binaries
x = []
y = []
label = []
for b in [AlAs, GaAs, InAs,
          AlSb, GaSb, InSb]:
    x.append(b.a(T=T))
    y.append(b.Eg(T=T) + b.VBO(T=T))
    label.append(b.name)
ax.plot(x, y, 'b.')

# label the binaries
for x, y, label in zip(x, y, label):
    ax.annotate(label, xy=(x, y), xytext=(-5, 5), ha='right', va='bottom',
                bbox=dict(linewidth=0, fc='white', alpha=0.9),
                textcoords='offset points')

# plot the ternaries
indices = numpy.arange(100)
fractions = numpy.linspace(0, 1, 100)
x = numpy.empty(100, dtype=numpy.float)
y = numpy.empty(100, dtype=numpy.float)
for tern in [AlGaAs, AlInAs, GaInAs,
             AlGaSb, AlInSb, GaInSb,
             AlAsSb, GaAsSb, InAsSb]:
    for i, f in zip(indices, fractions):
        instance = tern(x=f)
        x[i] = instance.a(T=T)
        y[i] = instance.Eg(T=T) + instance.VBO(T=T)
    ax.plot(x, y, 'b-')


# plot the binaries
x = []
y = []
label = []
for b in [AlAs, GaAs, InAs,
          AlSb, GaSb, InSb]:
    x.append(b.a(T=T))
    y.append(b.VBO(T=T))
    label.append(b.name)
ax.plot(x, y, 'r.')

# label the binaries
for x, y, label in zip(x, y, label):
    ax.annotate(label, xy=(x, y), xytext=(-5, 5), ha='right', va='bottom',
                bbox=dict(linewidth=0, fc='white', alpha=0.9),
                textcoords='offset points')

# plot the ternaries
indices = numpy.arange(100)
fractions = numpy.linspace(0, 1, 100)
x = numpy.empty(100, dtype=numpy.float)
y = numpy.empty(100, dtype=numpy.float)
for tern in [AlGaAs, AlInAs, GaInAs,
             AlGaSb, AlInSb, GaInSb,
             AlAsSb, GaAsSb, InAsSb]:
    for i, f in zip(indices, fractions):
        instance = tern(x=f)
        x[i] = instance.a(T=T)
        y[i] = instance.VBO(T=T)
    ax.plot(x, y, 'r-')

xmin, xmax = plt.xlim()
plt.xlim(xmin - 0.05, xmax)

if __name__ == '__main__':
    import sys
    if len(sys.argv) > 1:
        output_filename = sys.argv[1]
        plt.savefig(output_filename)
    else:
        plt.show()
Result: